

Spread-Spectrum-Modulation
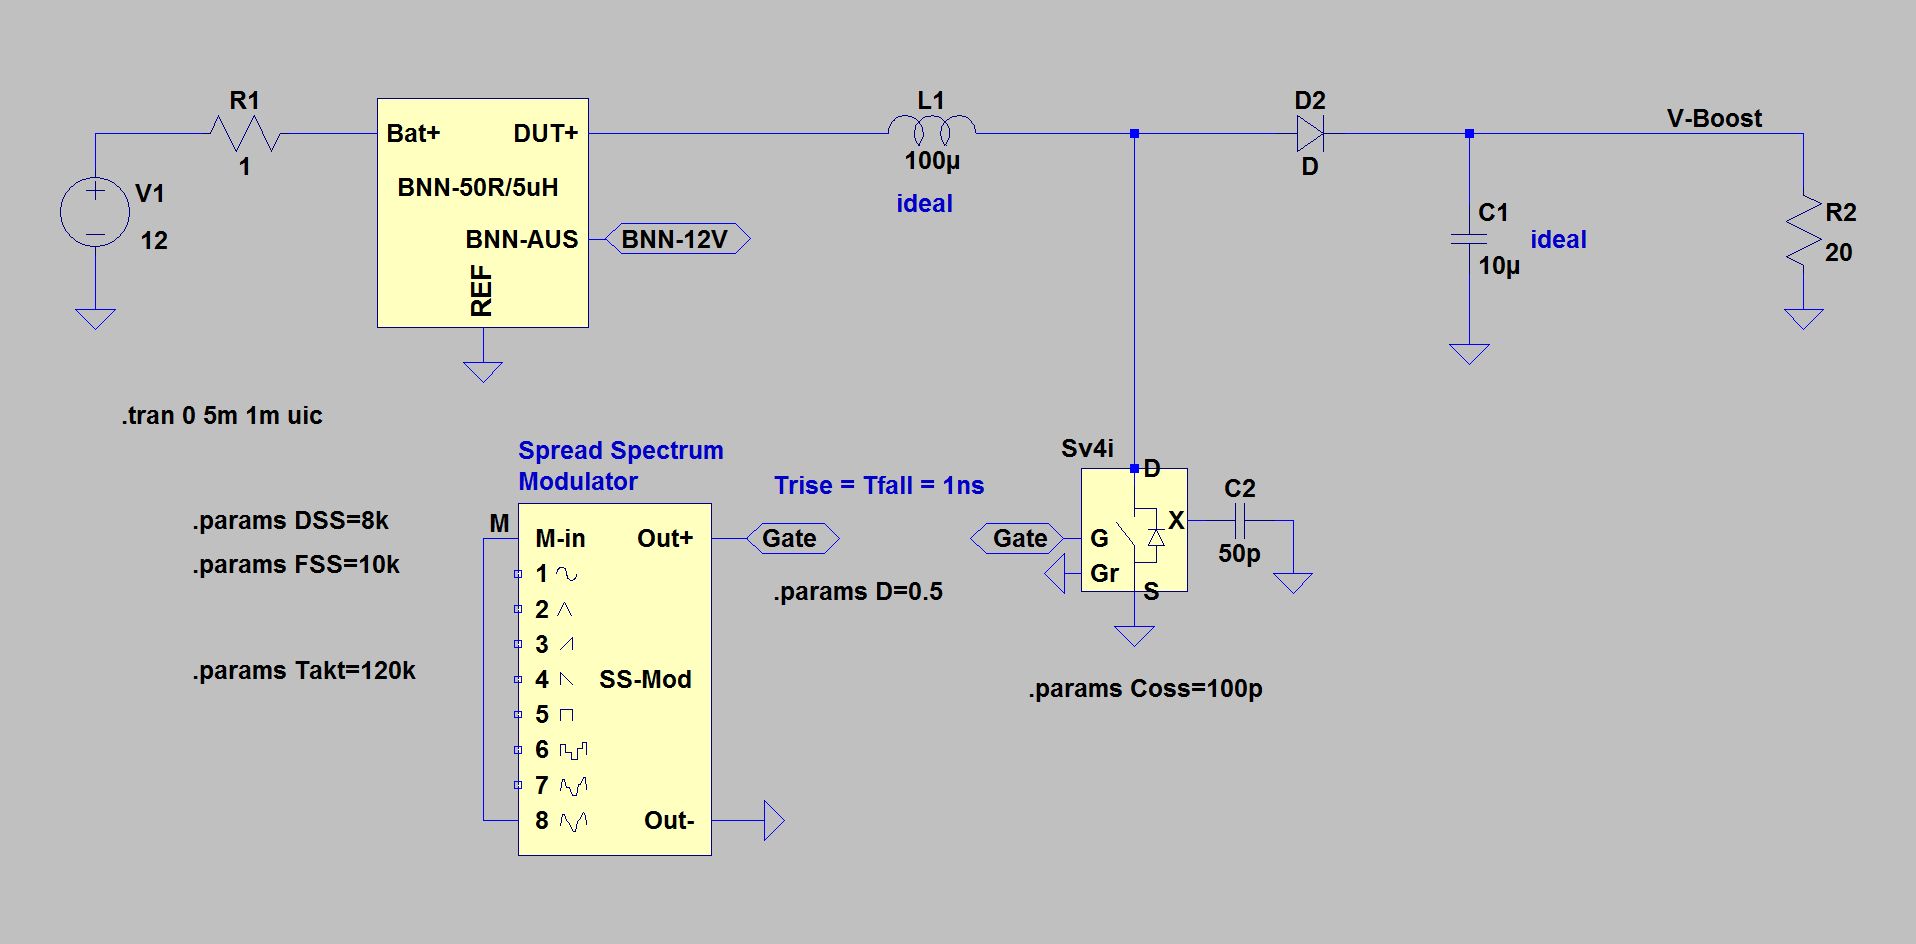
Booster with Spread-Spectrum-Modulation
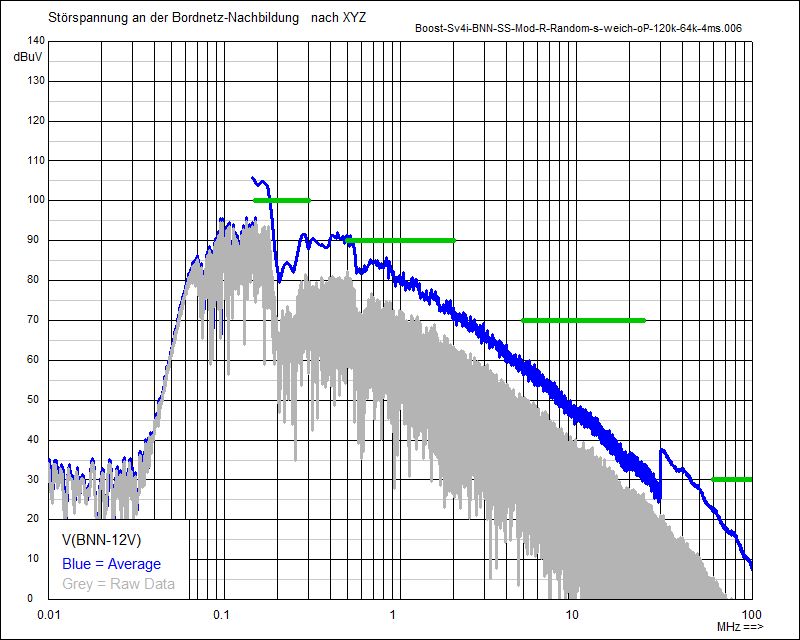
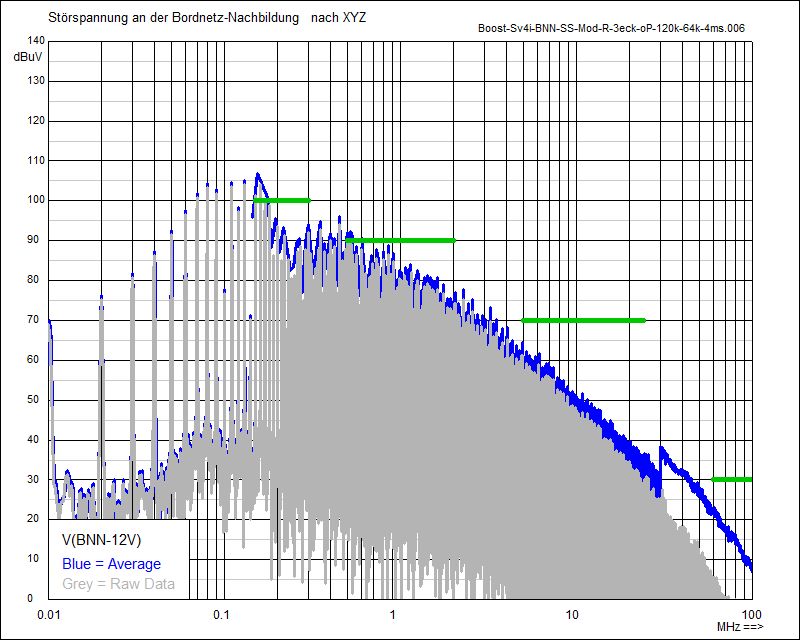
The following diagrams show the effect of the Delta-Frequency – i.e. the shift of the frequency from a fixed value to a new value with the maximum shift in the positive and negative direction by the Delta-Frequency, according to a selectable time course.
As examples, the Random Modulation and the Triangular Modulation were used. In order to have a sufficiently long measurement window for the random function, a measuring time of 4 ms was selected for all simulations.
.

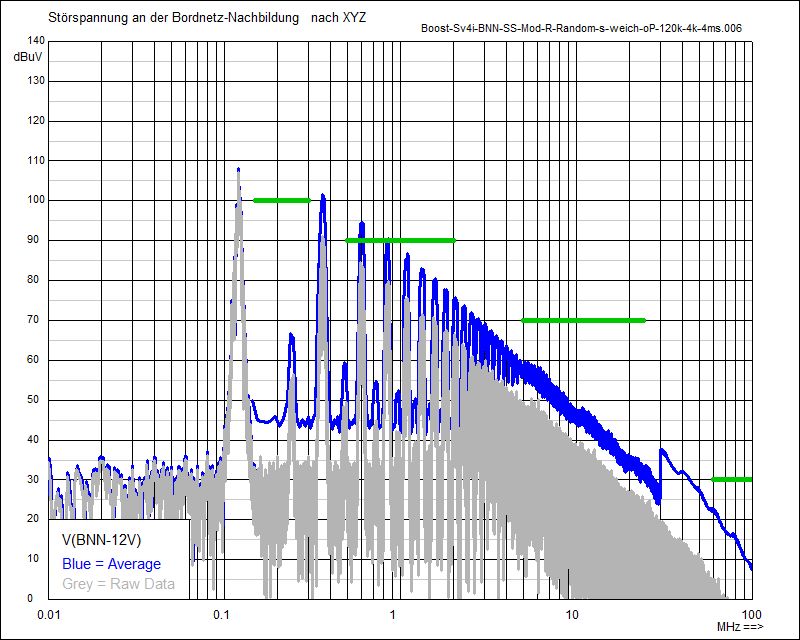
Random Modulation (super-soft) Delta-Frequency: 0 kHz
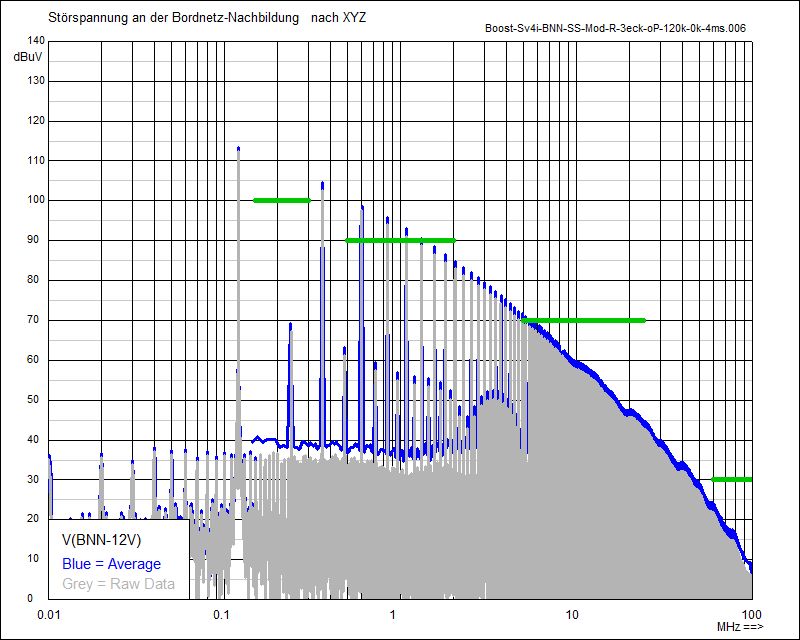
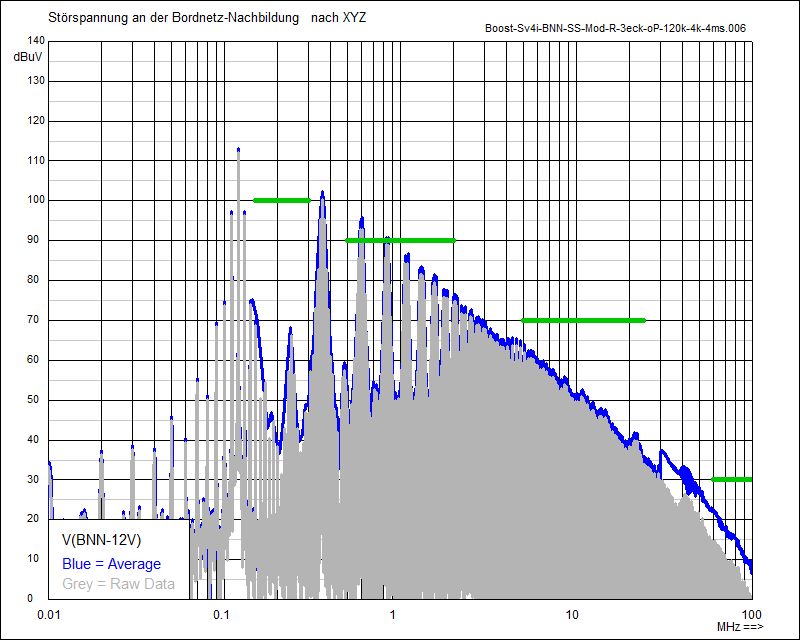
Triangular Modulation Delta-Frequency: 0 kHz
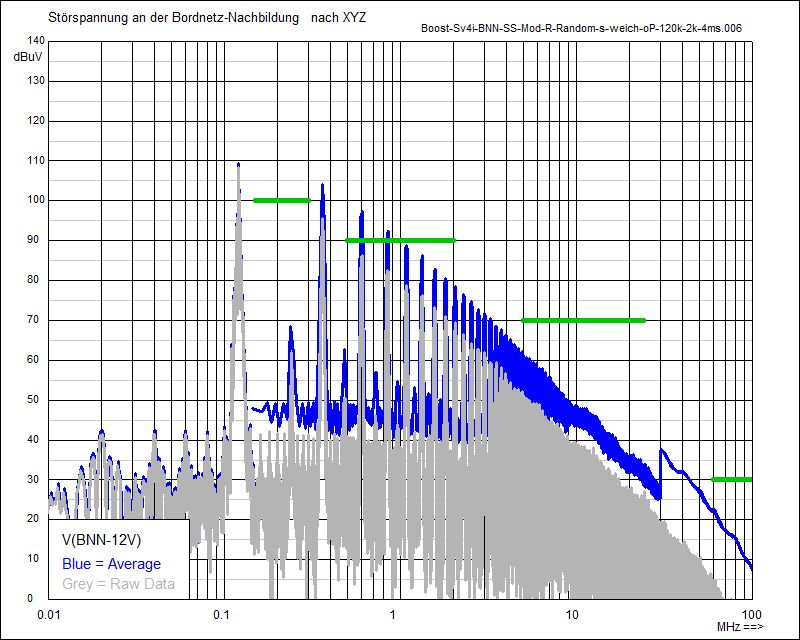
Random Modulation (super-soft) Delta-Frequency: 2 kHz
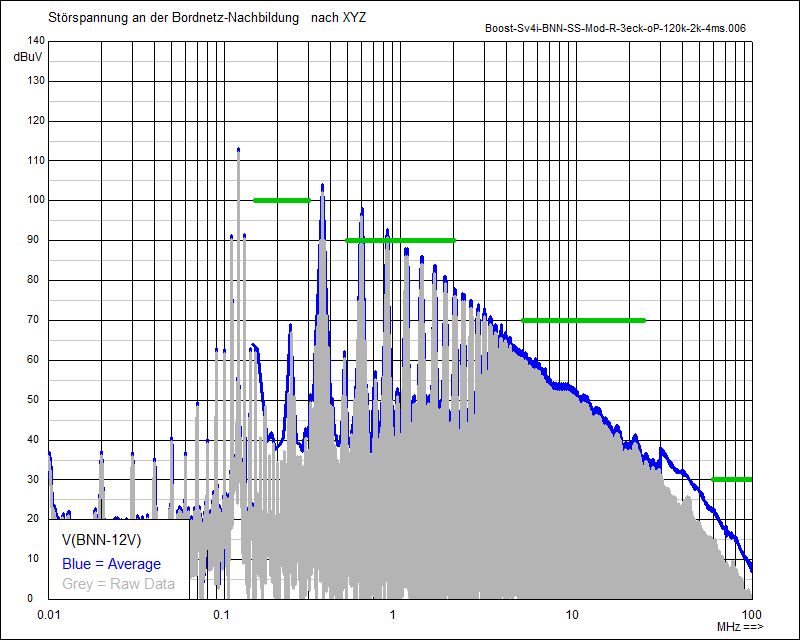
Triangular Modulation Delta-Frequency: 2 kHz
Random Modulation (super-soft) Delta-Frequency: 4 kHz
Triangular Modulation Delta-Frequency: 4 kHz
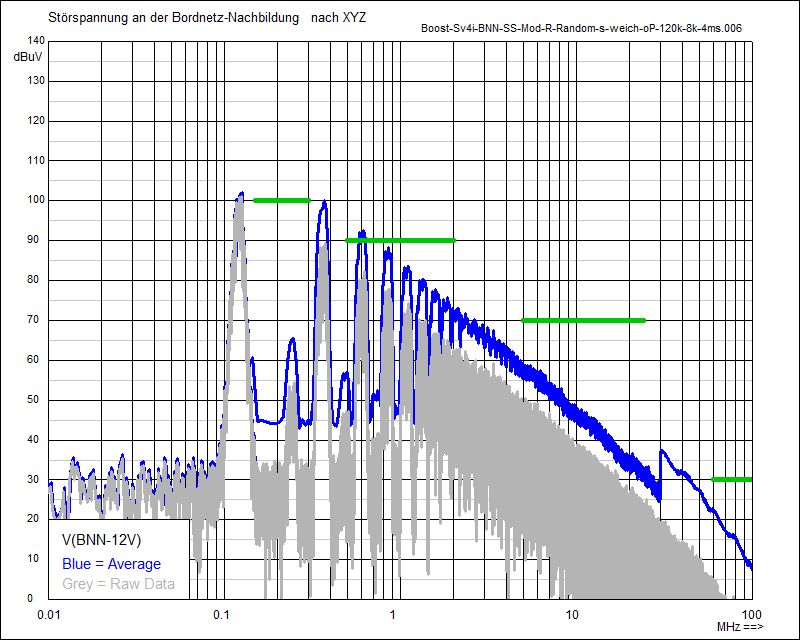
Random Modulation (super-soft) Delta-Frequency: 8 kHz
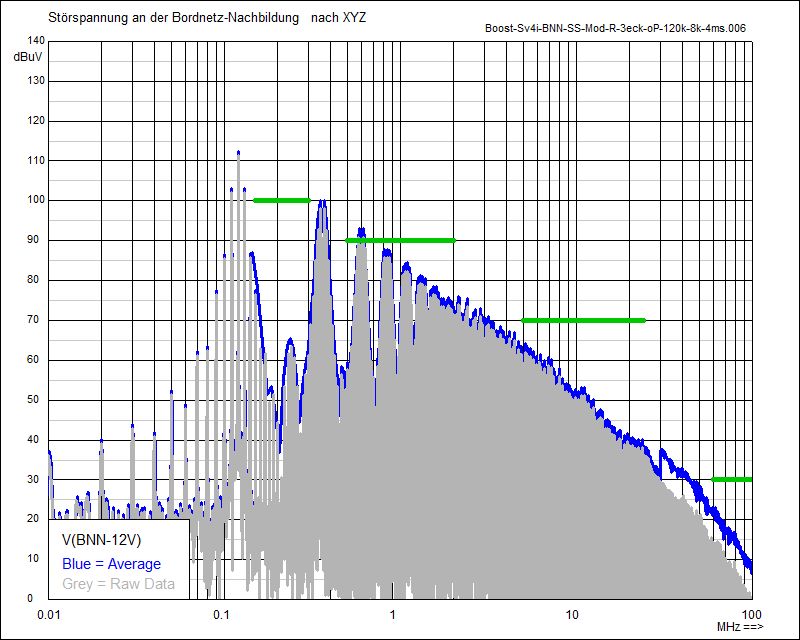
Triangular Modulation Delta-Frequency: 8 kHz
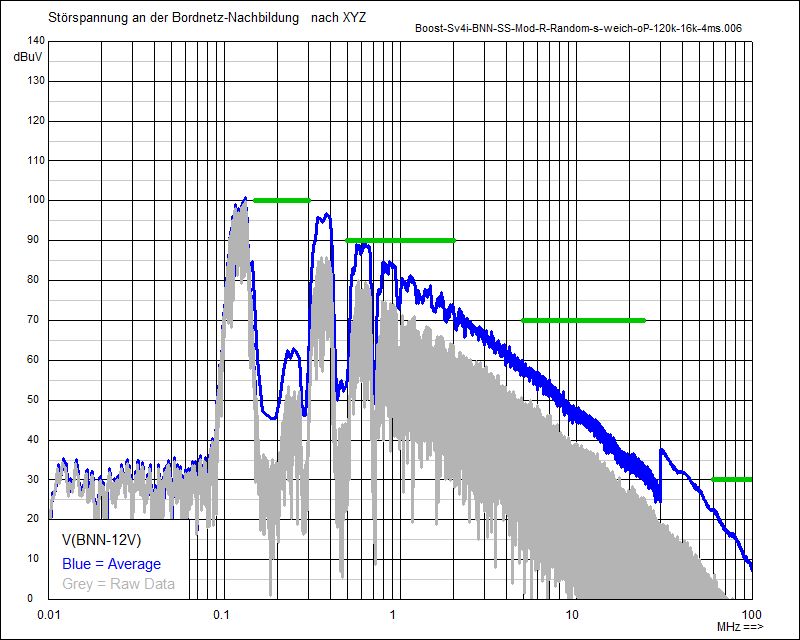
Random Modulation (super-soft) Delta-Frequency: 16 kHz
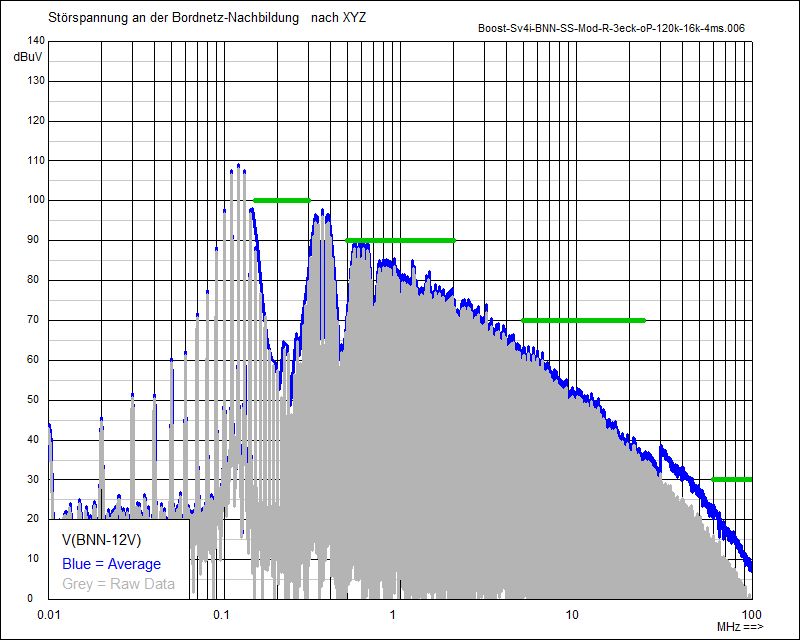
Triangular Modulation Delta-Frequency: 16 kHz
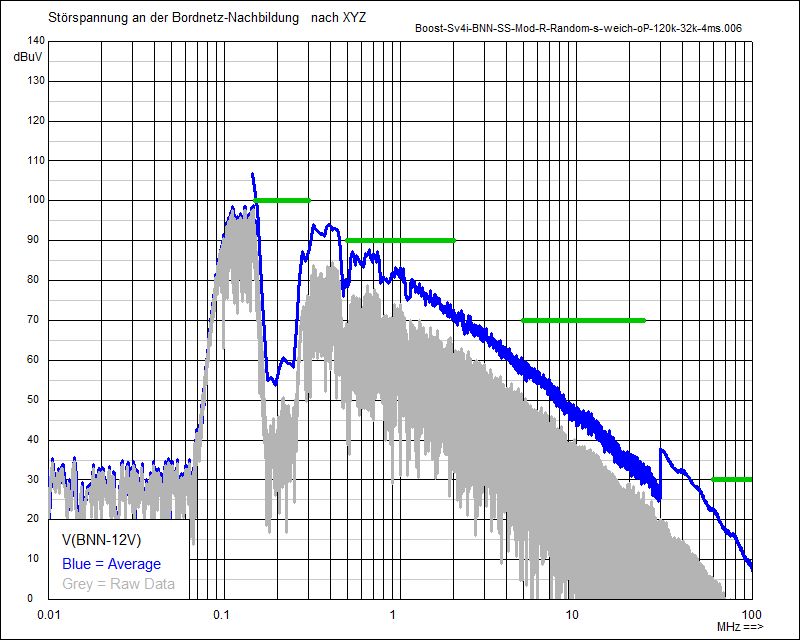
Random Modulation (super-soft) Delta-Frequency: 32 kHz
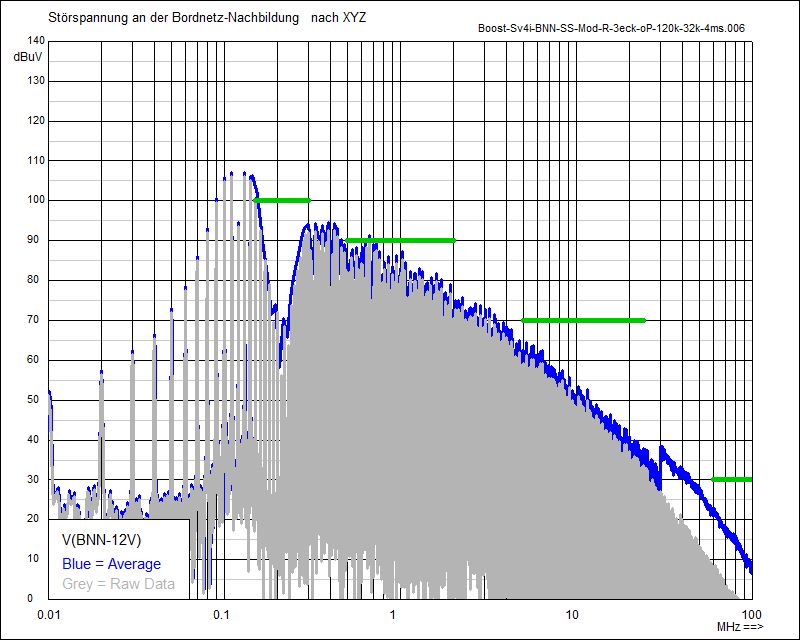
Triangular Modulation Delta-Frequency: 32 kHz
Random Modulation (super-soft) Delta-Frequency: 64 kHz
Triangular Modulation Delta-Frequency: 64 kHz
Both types of modulation show a similar behavior. Even at the small Delta-Frequency of 2 kHz, the maximum level reduction at 5 MHz is almost reached both in the Random Modulation and in the Triangular Modulation.
With a larger Delta-Frequency, the level at this frequency changes only slightly. With larger delta frequency, the influence goes down to ever lower frequencies.
By overlapping of the frequency shifts, it sometimes comes back to higher levels, especially in the Triangular Modulation.
Similar to the measuring time, the influence of the Delta-Frequency on the Random Modulation is more pronounced.
© Ingenieurbüro Lindenberger 8447